Many Visio shapes already contain Shape
Data fields, ready and waiting for your data. Whether or not these
fields are right for your business, they let you quickly see the kinds
of data you can attach to shapes.
Exploring Shape Data
Get a feel for Shape Data fields by looking at the fields in flowchart and network shapes.
Exploring Shape Data Fields
1. | Choose Flowchart, Basic Flowchart to start a new drawing.
|
2. | Drag any shape onto the page and inspect its Shape Data fields.
The Shape Data window normally resides on the left side of the drawing
window, docked above or below the Shapes window. As you can do with
most task panes, you can tear it off from the left and float it or dock
it to another side.
If you don’t see the Shape Data window, you can make it visible in the following three ways:
- Right-click any shape and choose Data, Shape Data.
- Go to View tab, Show, Task Panes, Shape Data.
- Go to the Data tab (Pro and Premium only), Show/Hide, Shape Data Window check box.
With the Shape Data window visible, you need only select shapes in the drawing window to see their Shape Data fields. |
3. | With
your flowchart shape still selected, note the different Shape Data
fields. Most flowchart shapes have seven fields: Cost, Process Number,
Owner, Function, Start Data, End Date, and Status. They are blank by
default, just waiting for you to fill them out with your
business-specific information.
|
4. | Inspect
the data fields for network equipment. Open the Computers and Monitors
stencil. You can access it via More Shapes, Network, Computers and
Monitors.
|
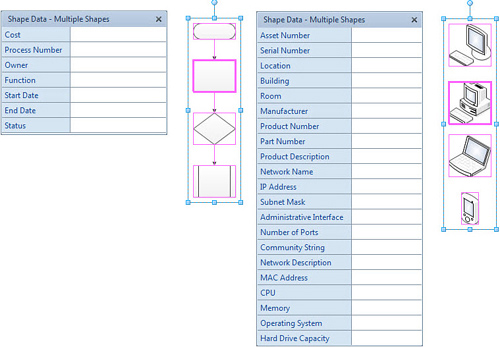
5. | Drag a few network equipment shapes onto the page. Network shapes have quite a few more fields than the flowchart shapes. Figure 1 contrasts flowchart and network Shape Data fields.

You can see that the flowchart fields are process related, and the
network fields relate to hardware, software, and facilities management. |
6. | Select
two or more flowchart shapes. Notice that their fields still appear in
the Shape Data window. The reason is that they have the same set of
fields.
|
7. | Select
a flowchart shape and network shape. The Shape Data window is empty.
Because flowchart and network shapes have no properties in common, the
Shape Data window punts and displays no fields. Shape Data only shows
fields that the selected shapes have in common. However, shapes that
have no data fields are ignored from this consideration. In Figure 1,
note that the connectors between the flowchart shapes are also
selected. Because they have no data fields, they don’t interfere with
this common-properties calculation.
|
8. | Set a value for multiple shapes at once. Select several flowchart shapes. In the Shape Data window, enter Bob for the Owner field.
|
9. | Click
on each flowchart shape separately. Notice that each shape received the
value Bob for its Owner property. You can set fields for many shapes in
one fell swoop!
|
10. | Note
the different types of data that Shape Data fields can hold. Select a
flowchart shape and enter some sample data for each field in the Shape
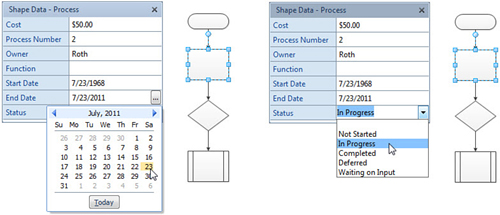
Data window. Figure 2 shows how different data types present different input controls.

Visio has some rudimentary data validation that enforces correct
entries. For example, in the Currency field, you must enter a number or
a currency value. |
So you can enter 1.50,
$1.50, or EUR 1.50, but not Bob. Process Number must be a number, but
Owner and Function can contain any text. The two date fields must have
date values. Status is a variable list; you can pick from the drop-down
list or enter a new value.
Types and Uses of Shape Data
Shape Data in flowchart and network shapes is purely
“data behind the shape.” The fields have no effect on how the shapes
appear but are useful for reports and interaction with the drawing.
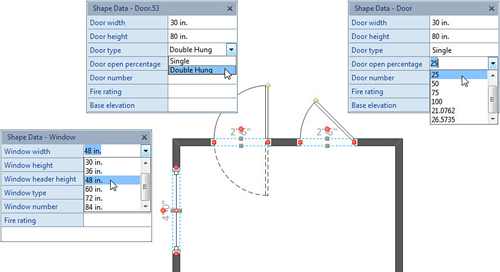
Contrast this with Figure 3,
where you see space planning shapes that graphically change depending
on Shape Data values. This figure shows window and door shapes from the
Walls, Shell, and Structure stencil (Accessed via: More Shapes, Maps
and Floor Plans, Building Plan).

In Figure 3,
the actual sizes of the shapes are affected by the Window Width and
Door Width field values. Because the drawing is scaled, you can work in
real-world units and choose typical door and window sizes from the pick
lists.
Interestingly, the two door shapes come
from the same master. The result of picking different door types and
changing the opening percentage is shapes that are quite different in
appearance. Because SmartShapes can be configured in so many different
ways, the number of masters in stencils is vastly reduced. Other
graphics programs supply hundreds of door symbols, but Visio has only a
few—and these have hundreds of possible configurations thanks to Shape
Data.